The market volatility continues. How to determine when the pullback is over?

Original Author: Murphy, On-chain Data Analyst
How to Determine if a Pullback is About to End?
There are many methods to determine if a short-term pullback is about to end. As mentioned before, analysis can be conducted from different perspectives such as chip structure, financial pressure, sentiment feedback, etc. Today, I will share another method that I often use and find very effective, which is to observe the cost basis changes of different time cohorts as a reference point.
Before discussing the logic, let's first look at a case study—the bottom judgment of a large cycle
In Figure 1 below, the blue line represents Long-Term Holder's Average Cost Basis (LTH-RPC), the red line represents Short-Term Holder's Average Cost Basis (STH-RPC), and the black line is BTC's price.
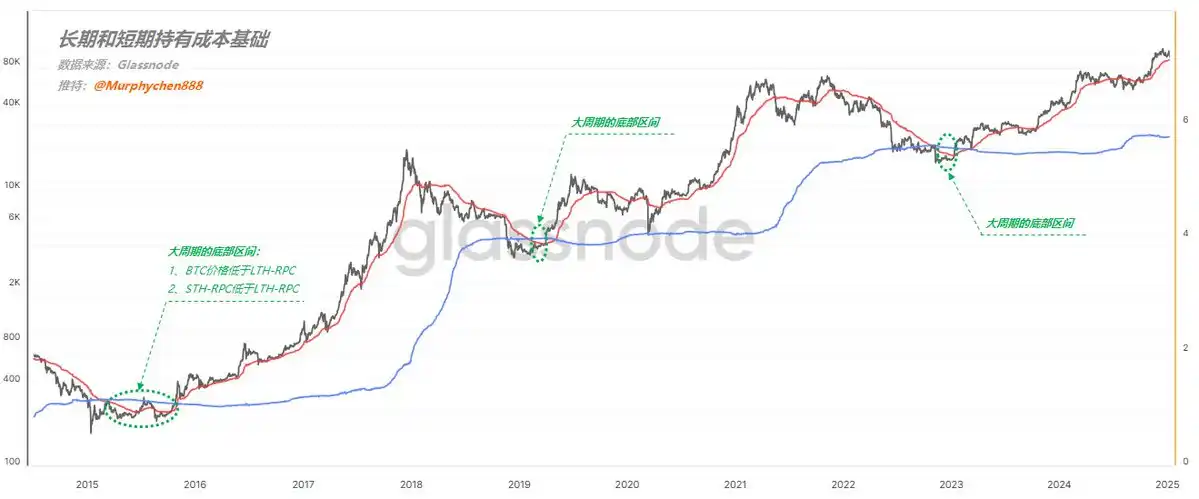
(Figure 1)
Pay attention to the area I have circled in green with a dotted line. As long as the following 2 conditions are met simultaneously:
- Condition 1, BTC price is below LTH-RPC
- Condition 2, STH-RPC is below LTH-RPC
This stage is the bottom range of the large cycle and is also an excellent opportunity to buy the dip!
The underlying logic is as follows:
First, when the BTC price falls below the LTH-RPC, it means that the average cost of long-term holders is at a loss. This indicates that the price is severely undervalued, and the market bubble has almost completely burst.
Second, in the vast majority of time, the longer the chip holding period, the lower the relative cost. Therefore, it is extremely rare for STH-RPC to be lower than LTH-RPC.
It indicates that during the price decline, there were a large number of loss-exiting short-term holders, but new short-term holders entered to buy the dip. After frequent turnover, the cost of short-term chips was actually pulled below the cost of long-term chips. This is a phase of oversold prices, signaling the bottom of the panic sentiment. Following the logic above, we can also apply the same reasoning to determine the duration of a bull market pullback.
Figure 2 below lists the cost bases for: 1d-1w (red line), 1w-1m (yellow line), 1m-3m (blue line), 3m-6m (purple line)

(Figure 2)
First, let's look at February to May 24th, which happens to be the process from the start of a trend to decay and a pullback. The entire process is accompanied by the widening and narrowing of the distance between the blue line and the red line (as indicated by the green arrows in the image);
Eventually, the blue line ran to the top, while the red line was at the bottom, meaning that the relative short-term cost of chips was lower than the relative long-term cost of chips. I call this phenomenon the "reverse arrangement structure" of long-term and short-term costs.
I marked three points in the image with orange dashed lines, all of which show the formation of a blue, yellow, red arrangement from top to bottom, or a purple, blue, yellow, red arrangement, representing the relative bottoms during pullbacks.
So, the current trend is also transitioning from rapid expansion to gradual contraction, but the blue line is still below. If we are to see a market restart in the short term, perhaps a "reverse arrangement structure" needs to be formed first. However, after this period of turnover, the blue line is already very close to the red and yellow 2 lines. As long as there is another period of consolidation, the structure can form, thereby meeting the conditions for forming a relative bottom.
PS: Of course, it would be best to form a purple, blue, yellow, red "reverse arrangement structure," but this would require a longer turnover time (at least 4-5 months).
Summary:
Based on the change in the cost base of different time groups as the basis for judging the time of a pullback, the higher the relative cost of long-term chips, the closer we are to the bottom once a blue, yellow, red "reverse arrangement structure" is formed from top to bottom. This indicates that turnover is sufficient, sentiment is close to the bottom, and the pullback time is coming to an end.
The content shared in this article is for communication and research purposes only and should not be construed as investment advice.
You may also like

The encrypted unicorn Blockstream is deeply embroiled in a serious fraud case

How xBubble Breaks the Deadlock in VC's Heavy Investment in the OPC Economy

Dragonfly partner Haseeb: The fastest-growing companies in the future may all be stuck at 149 people

Morning Report | Former Ethereum Foundation researcher establishes Ethlabs; EU Parliament Economic Committee passes digital euro regulatory proposal

Interview with NDV Founder Jason Huang: Popping the AI Bubble and the Myth of Microstrategy, Seeking the Ultimate Ace in the Crypto Market

Morning Report | The South Korean Financial Services Commission plans to expand the regulatory sandbox to include virtual assets; the parent company of the New York Stock Exchange, ICE, has reached a partnership with OKX to jointly establish a cryptocu...

Exclusive Interview with Strategy CEO: Putting Aside the Sale of 32 BTC, the 60 Trillion AI Intelligence is the Ultimate Fate of Bitcoin

TRON revitalizes the image of the bull, creating a more approachable brand character
Will the STRC issuance price discussed with ChatGPT really fall into a death spiral?

The foundation retreats, Ethlabs steps forward: Ethereum welcomes its largest restructuring in history

NYSE Parent ICE and OKX Launch Joint Venture: What It Means for Tokenized Stocks
ICE and OKX have announced a joint venture focused on tokenized stocks, but stock futures are already live across crypto markets. Here's what the partnership means, how stock futures work, and why traders are paying attention.

How to Trade Apple and Nvidia on a Crypto Exchange in 2026 (Without Buying Shares)
Morning Report | Secret Network loses $4.67 million due to cross-chain vulnerability; Michael Saylor releases Bitcoin Tracker information again, may disclose increased holdings data next week
Kalshi's biggest competitor is not Polymarket

The second half of the computing power battle: Intel CEO Pat Gelsinger reveals how AI is reshaping the global semiconductor supply chain
B.AI partners with MiniMax to launch a limited-time free experience of M3, enabling zero-threshold implementation of Agentic productivity through full-stack infrastructure

A company that was on the verge of bankruptcy has just surpassed Bitcoin in market value

